Howto setup a haproxy as fault tolerant / high available load balancer for multiple caching web proxies on RHEL/Centos/SL
February 12, 2012
As I didn’t find much documentation on the topic of setting up a load balancer for multiple caching web proxies, specially in a high availability way on common Linux enterprise distributions I sat down and wrote this howto.
If you’re working at a large organization, one web proxy will not be able to handle the whole load and you’ll also like some redundancy in case one proxy fails. A common setup is in this case to use the pac file to tell the client to use different proxies, for example one for .com addresses and one for all others, or a random value for each page request. Others use DNS round robin to balance the load between the proxies. In both cases you can remove one proxy node from the wheel for maintenances or of it goes down. But thats not done withing seconds and automatically. This howto will show you how to setup a haproxy with corosync and pacemaker on RHEL6, Centos6 or SL6 as TCP load balancer for multiple HTTP proxies, which does exactly that. It will be high available by itself and also recognize if one proxy does not accept connections anymore and will remove it automatically from the load balancing until it is back in operation.
The Setup
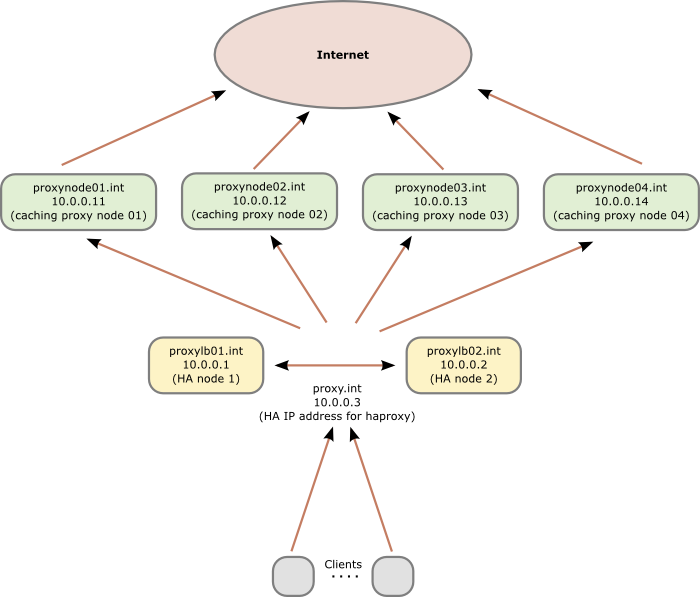
As many organizations will have appliances (which do much more than just caching the web) as their web proxies, I will show a setup with two additional servers (can be virtual or physical) which are used as load balancer. If you in your organization have normal Linux server as your web proxies you can of course use two or more also as load balancer nodes.
Following diagram shows the principle setup and the IP addresses and hostnames used in this howto:

Preconditions
As the proxies and therefore the load balancer are normally in the external DMZ we care about security and therefore we’ll check that Selinux is activated. The whole setup will run with SeLinux actived without changing anything. For this we take a look at /etc/sysconfig/selinux and verify that SELINUX is set to enforcing. Change it if not and reboot. You should also install some packages with
yum install setroubleshoot setools-console
and make sure all is running with
[root@proxylb01/02 ~]# sestatus

SELinux status: enabled

SELinuxfs mount: /selinux

Current mode: enforcing

Mode from config file: enforcing

Policy version: 24

Policy from config file: targeted
and
[root@proxylb01/02 ~]# /etc/init.d/auditd status

auditd (pid 1047) is running...
on both nodes. After this we make sure that our own host names are in the hosts files for security reasons and if the the DNS servers go down. The /etc/hosts file on both nodes should contain following:
10.0.0.1 proxylb01 proxylb01.int

10.0.0.2 proxylb02 proxylb02.int

10.0.0.3 proxy proxy.int
Software Installation and corosync setup
We need to add some additional repositories to get the required software. The package for haproxy is in the EPEL repositories. corosync and pacemaker are shipped as part of the distribution in Centos 6 and Scientific Linux 6, but you need the High Availability Addon for RHEL6 to get the packages.
Install all the software we need with
[root@proxylb01/02 ~]# yum install pacemaker haproxy

[root@proxylb01/02 ~]# chkconfig corosync on

[root@proxylb01/02 ~]# chkconfig pacemaker on
We use the example corsync config as starting point:
[root@proxylb01/02 ~]# cp /etc/corosync/corosync.conf.example /etc/corosync/corosync.conf
And we add following lines after the version definition line:
# How long before declaring a token lost (ms)

token: 5000
# How many token retransmits before forming a new configuration

token_retransmits_before_loss_const: 20
# How long to wait for join messages in the membership protocol (ms)

join: 1000
# How long to wait for consensus to be achieved before starting a new round of membership configuration (ms)

consensus: 7500
# Turn off the virtual synchrony filter

vsftype: none
# Number of messages that may be sent by one processor on receipt of the token

max_messages: 20
These values make the switching slower than default, but less trigger happy. This is required in my case as we’ve the machines running in VMware, where we use the snapshot feature to make backups and also move the VMware instances around. In both cases we’ve seen timeouts under high load of up to 4 seconds, normally 1-2 seconds.
Some lines later we’ve define the interfaces:
interface {

member {

memberaddr: 10.0.0.1

}

member {

memberaddr: 10.0.0.2

}

ringnumber: 0

bindnetaddr: 10.0.0.0

mcastport: 5405

ttl: 1

}

transport: udpu
We use the new unicast feature introduced in RHEL 6.2, if you’ve an older version you need to use the multicast method. Of course you can use the multicast method also with 6.2 and higher, I just didn’t see the purpose of it for 2 nodes. The configuration file /etc/corosync/corosync.conf is the same on both nodes so you can copy it.
Now we need to define pacemaker as our resource handler with following command:
[root@proxylb01/02 ~]# cat < <-END >>/etc/corosync/service.d/pcmk

service {

# Load the Pacemaker Cluster Resource Manager

name: pacemaker

ver: 1

}

END
Now we’ve ready to test-fly it and …
[root@proxylb01/02 ~]# /etc/init.d/corosync start
… do some error checking …
[root@proxylb01/02 ~]# grep -e "corosync.*network interface" -e "Corosync Cluster Engine" -e "Successfully read main configuration file" /var/log/messages

Feb 10 11:03:20 proxylb01/02 corosync[1691]: [MAIN ] Corosync Cluster Engine ('1.2.3'): started and ready to provide service.

Feb 10 11:03:20 proxylb01/02 corosync[1691]: [MAIN ] Successfully read main configuration file '/etc/corosync/corosync.conf'.

Feb 10 11:03:21 proxylb01/02 corosync[1691]: [TOTEM ] The network interface [10.0.0.1/2] is now up.
… and some more.
[root@proxylb01/02 ~]# grep TOTEM /var/log/messages

Feb 10 11:03:20 proxylb01/02 corosync[1691]: [TOTEM ] Initializing transport (UDP/IP Unicast).

Feb 10 11:03:20 proxylb01/02 corosync[1691]: [TOTEM ] Initializing transmit/receive security: libtomcrypt SOBER128/SHA1HMAC (mode 0).

Feb 10 11:03:21 proxylb01/02 corosync[1691]: [TOTEM ] The network interface [10.0.0.1/2] is now up.

Feb 10 11:03:21 proxylb01/02 corosync[1691]: [TOTEM ] A processor joined or left the membership and a new membership was formed.

Feb 10 11:03:21 proxylb01/02 corosync[1691]: [TOTEM ] A processor joined or left the membership and a new membership was formed.
Pacemaker setup
Now we need to check Pacemaker …
[root@proxylb01/02 ~]# grep pcmk_startup /var/log/messages

Feb 10 11:03:21 proxylb01/02 corosync[1691]: [pcmk ] info: pcmk_startup: CRM: Initialized

Feb 10 11:03:21 proxylb01/02 corosync[1691]: [pcmk ] Logging: Initialized pcmk_startup

Feb 10 11:03:21 proxylb01/02 corosync[1691]: [pcmk ] info: pcmk_startup: Maximum core file size is: 18446744073709551615

Feb 10 11:03:21 proxylb01/02 corosync[1691]: [pcmk ] info: pcmk_startup: Service: 10

Feb 10 11:03:21 proxylb01/02 corosync[1691]: [pcmk ] info: pcmk_startup: Local hostname: proxylb01/02.int
… and start it …
[root@proxylb01/02 ~]# /etc/init.d/pacemaker start

Starting Pacemaker Cluster Manager: [ OK ]
… and do some more error checking:
[root@proxylb01/02 ~]# grep -e pacemakerd.*get_config_opt -e pacemakerd.*start_child -e "Starting Pacemaker" /var/log/messages

Feb 10 11:05:41 proxylb01/02 pacemakerd: [1709]: info: get_config_opt: Found 'pacemaker' for option: name

Feb 10 11:05:41 proxylb01/02 pacemakerd: [1709]: info: get_config_opt: Found '1' for option: ver

Feb 10 11:05:41 proxylb01/02 pacemakerd: [1709]: info: get_config_opt: Defaulting to 'no' for option: use_logd

Feb 10 11:05:41 proxylb01/02 pacemakerd: [1709]: info: get_config_opt: Defaulting to 'no' for option: use_mgmtd

Feb 10 11:05:41 proxylb01/02 pacemakerd: [1709]: info: get_config_opt: Found 'off' for option: debug

Feb 10 11:05:41 proxylb01/02 pacemakerd: [1709]: info: get_config_opt: Found 'yes' for option: to_logfile

Feb 10 11:05:41 proxylb01/02 pacemakerd: [1709]: info: get_config_opt: Found '/var/log/cluster/corosync.log' for option: logfile

Feb 10 11:05:41 proxylb01/02 pacemakerd: [1709]: info: get_config_opt: Found 'yes' for option: to_syslog

Feb 10 11:05:41 proxylb01/02 pacemakerd: [1709]: info: get_config_opt: Defaulting to 'daemon' for option: syslog_facility

Feb 10 11:05:41 proxylb01/02 pacemakerd: [1711]: info: main: Starting Pacemaker 1.1.5-5.el6 (Build: 01e86afaaa6d4a8c4836f68df80ababd6ca3902f): manpages docbook-manpages publican ncurses cman cs-quorum corosync snmp libesmtp

Feb 10 11:05:41 proxylb01/02 pacemakerd: [1711]: info: start_child: Forked child 1715 for process stonith-ng

Feb 10 11:05:41 proxylb01/02 pacemakerd: [1711]: info: start_child: Forked child 1716 for process cib

Feb 10 11:05:41 proxylb01/02 pacemakerd: [1711]: info: start_child: Forked child 1717 for process lrmd

Feb 10 11:05:41 proxylb01/02 pacemakerd: [1711]: info: start_child: Forked child 1718 for process attrd

Feb 10 11:05:41 proxylb01/02 pacemakerd: [1711]: info: start_child: Forked child 1719 for process pengine

Feb 10 11:05:41 proxylb01/02 pacemakerd: [1711]: info: start_child: Forked child 1720 for process crmd
We should also make sure that the process is running …
[root@proxylb01/02 ~]# ps axf | grep pacemakerd

6560 pts/0 S 0:00 pacemakerd

6564 ? Ss 0:00 \_ /usr/lib64/heartbeat/stonithd

6565 ? Ss 0:00 \_ /usr/lib64/heartbeat/cib

6566 ? Ss 0:00 \_ /usr/lib64/heartbeat/lrmd

6567 ? Ss 0:00 \_ /usr/lib64/heartbeat/attrd

6568 ? Ss 0:00 \_ /usr/lib64/heartbeat/pengine

6569 ? Ss 0:00 \_ /usr/lib64/heartbeat/crmd
and as a last check, take a look if there is any error message in the /var/log/messages with
[root@proxylb01/02 ~]# grep ERROR: /var/log/messages | grep -v unpack_resources
which should return nothing.
cluster configuration
We’ll change into the cluster configuration and administration CLI with the command crm and check the default configuration, which should look like this:
crm(live)# configure show

node proxylb01.int

node proxylb02.int

property $id="cib-bootstrap-options" \

dc-version="1.1.5-5.el6-01e86afaaa6d4a8c4836f68df80ababd6ca3902f" \

cluster-infrastructure="openais" \

expected-quorum-votes="2"

crm(live)# bye
And if we call following:
[root@proxylb01/02 ~]# crm_verify -L

crm_verify[1770]: 2012/02/10_11:08:22 ERROR: unpack_resources: Resource start-up disabled since no STONITH resources have been defined

crm_verify[1770]: 2012/02/10_11:08:22 ERROR: unpack_resources: Either configure some or disable STONITH with the stonith-enabled option

crm_verify[1770]: 2012/02/10_11:08:22 ERROR: unpack_resources: NOTE: Clusters with shared data need STONITH to ensure data integrity

Errors found during check: config not valid

-V may provide more details
We see that STONITH, has not been configurated, but we don’t need it as we have no filesystem or database running which could go corrupt, so we disable it.
[root@proxylb01/02 ~]# crm configure property stonith-enabled=false

[root@proxylb01/02 ~]# crm_verify -L
Now we download the OCF script for haproxy
[root@proxylb01/02 ~]# wget -O /usr/lib/ocf/resource.d/heartbeat/haproxy http://github.com/russki/cluster-agents/raw/master/haproxy

[root@proxylb01/02 ~]# chmod 755 /usr/lib/ocf/resource.d/heartbeat/haproxy
After this we’re ready to configure the cluster with following commands:
[root@wgwlb01 ~]# crm

crm(live)# configure

crm(live)configure# primitive haproxyIP03 ocf:heartbeat:IPaddr2 params ip=10.0.0.3 cidr_netmask=32 op monitor interval=5s

crm(live)configure# group haproxyIPs haproxyIP03 meta ordered=false

crm(live)configure# property no-quorum-policy=ignore

crm(live)configure# primitive haproxyLB ocf:heartbeat:haproxy params conffile=/etc/haproxy/haproxy.cfg op monitor interval=30s

crm(live)configure# colocation haproxyWithIPs INFINITY: haproxyLB haproxyIPs

crm(live)configure# order haproxyAfterIPs mandatory: haproxyIPs haproxyLB

crm(live)configure# commit
These commands added the floating IP address to the cluster and than we created an group of IP addresses in case we later need more than one. We than defined that we need no quorum and added the haproxy to the mix and we made sure that the haproxy and its IP address is always on the same node and that the IP address is brought up before haproxy is.
Now the cluster setup is done and you should see the haproxy running on one node with crm_mon -1.
haproxy configuration
We now only need to setup haproxy, which is done by configurating following file: /etc/haproxy/haproxy.cfg
We make sure that haproxy is sending logfiles by having following in the global section
log 127.0.0.1 local2 notice
and set maxconn 8000 (or more if you need more). The defaults sections looks following in my setup:
log global

# 30 minutes of waiting for a web request is crazy,

# but some users do it, and then complain the proxy

# broke the interwebs.

timeout client 30m

timeout server 30m

# If the server doesnt respond in 4 seconds its dead

timeout connect 4s
And now the actual load balancer configuration
listen http_proxy 10.0.0.3:3128

mode tcp

balance roundrobin

server proxynode01 10.0.0.11 check

server proxynode02 10.0.0.12 check

server proxynode03 10.0.0.13 check

server proxynode04 10.0.0.14 check
If your caches have public IP addresses and are not natted to one outgoing IP address, you may wish to change the balance algorithm to source. Some web applications get confused when a client’s IP address changes between requests. Using balance source load balances clients across all web proxies, but once a client is assigned to a specific proxy, it continues to use that proxy.
And we would like to see some stats so we configure following:
listen statslb01/02 :8080 # choose different names for the 2 nodes

mode http

stats enable

stats hide-version

stats realm Haproxy\ Statistics

stats uri /

stats auth admin:xxxxxxxxx
rsyslog setup
haproxy does not write its own log files, so we need to configure rsyslog for this. We add following to the MODULES configuration in /etc/rsyslog.conf
$ModLoad imudp.so

$UDPServerRun 514

$UDPServerAddress 127.0.0.1
and following to the RULES section.
local2.* /var/log/haproxy.log
and at last we do a configuration reload for haproxy with
[root@wgwlb01 ~]# /etc/init.d/haproxy reload
After all this work, you should have a working high availability haproxy setup for your proxies. If you have any comments please don’t hesitate to write a comment!
A1 Telekom Austria Internet via UMTS seems to have a forced disconnet every 8h
December 31, 2011
I think it is well known that the DSL Internet plans from A1 Telekom Austria for private user (= not the more expensive business plans) have a forced 8h disconnect. I searched the Internet to check if it is the same for there UMTS USB sticks, and couldn’t find anything – seems that nobody cares or tried it. So I put the USB Stick into my server and let it run for a week now, and I can say now: Yes, there is a forced disconnect normally every 8h … but sometimes they seem to miss it. Take a look at the last few days – I did a grep on the connect time and the pid of the umts pppd:
# cat /var/log/messages | grep "Connect time" | grep "9069"
Dec 27 20:56:17 xxx pppd[9069]: Connect time 480.0 minutes.
Dec 28 04:56:53 xxx pppd[9069]: Connect time 480.0 minutes.
Dec 28 12:57:00 xxx pppd[9069]: Connect time 480.0 minutes.
Dec 28 20:57:05 xxx pppd[9069]: Connect time 480.0 minutes.
Dec 29 04:57:42 xxx pppd[9069]: Connect time 480.0 minutes.
Dec 29 12:57:49 xxx pppd[9069]: Connect time 480.1 minutes.
Dec 29 22:20:09 xxx pppd[9069]: Connect time 561.8 minutes.
Dec 30 06:20:44 xxx pppd[9069]: Connect time 480.0 minutes.
Dec 30 14:23:20 xxx pppd[9069]: Connect time 482.5 minutes.
Dec 30 22:05:07 xxx pppd[9069]: Connect time 461.7 minutes.
Dec 31 06:05:44 xxx pppd[9069]: Connect time 480.0 minutes.
Dec 31 14:06:21 xxx pppd[9069]: Connect time 480.1 minutes.
ps: 480min = 8h
Somebody knows why they are missing some disconnect times? Maybe it is traffic related – I try to make some traffic every few seconds on the link to verify that.
A1 Telekom Austria uses internal IPs (10.x.x.x) for traffic between UMTS and DSL
December 25, 2011
When I tried to connect from my mobile phone to my DSL router at home and had tcpdump running on the router at the same time I though there is something wrong. I saw connection requests from an 10.62.35.x IP address from the Internet. My router was of course dropping these packets, as this IP address cannot arrive on the Internet uplink interface.
After some checking I realized that my mobile phone is the 10.62.35.x source address, and I needed to accept packets from on the Internet with the source address within the range of 10.62.0.0/16. It is good that I don’t use 10.62.0.0/16 subnets at home …. but if someone does, he has a problem. 😉
Anyway has anyone more information which 10.x.x.x IP addresses the A1 Telekom Austria (and Bob for my mobile) does use?
ps: The DSL router has a worldwide IP address but the mobile IP is local, surely to force businesses into more expensive plans to have a worldwide IP address. 😉
Workaround for routing WOL (Wake on LAN) packets with Linux
January 16, 2010
If you want to send a WOL packet to a PC within your subnet it is really easy. Just install a program like wakeonlan (apt-get install wakeonlan) and type something like:
wakeonlan 01:02:03:04:05:06
But how to you send a WOL packet to an other subnet? Basically you use a UDP packet and send it to the broadcast address of the other network. e.g. with wakeonlan it looks like this
wakeonlan -i 192.168.1.255 01:02:03:04:05:06
But you need support for this from your router, as normally they don’t allow sending to the broadcast address from other networks. Professional routers/layer3 switches have support for this (you just need to enable it), but you’ve a Linux router at home? (e.g. one with Openwrt or Debian/Ubuntu)
The simplest way to get it working is to enter following on the router (rerun it at every boot):
arp -s 192.168.1.254 FF:FF:FF:FF:FF:FF
This tells the router that the given IP has a MAC address which is used for broadcasts. Now you only need to send the packet to this new “broadcast” address instead of the real one. So your wakeup call looks like this:
wakeonlan -i 192.168.1.254 01:02:03:04:05:06
ps: you should only enable something like this on a trusted network and the IP address you use should be not used by any other device.
Do you know SmokePing or StrafePing?
November 25, 2008
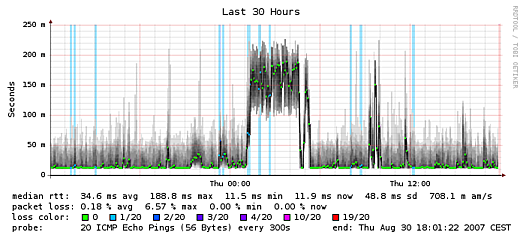
The word part “ping” leads you to ICMP packages, Ok – but what is special with Smoke or Strafe Ping? Basically they send multiple ICMP echo requests on block to a given target on block and stores the response-time of each as well as the packet loss. SmokePing is the inventor of this technique and consists of a daemon process which organizes the latency measurements and a CGI which presents the graphs.
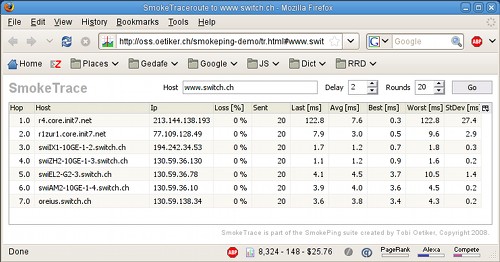
Here are some screenshots from the authors homepage:


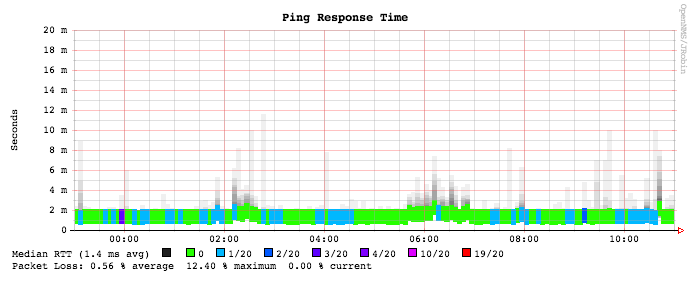
StrafePing is a feature in OpenNMS, which is a network management system and you can activate it for the nodes it monitors. Here is a screenshot for this too:

Powered by WordPress
Entries and comments feeds.
Valid XHTML and CSS.
36 queries. 0.060 seconds.


