Mini Howto for JMeter, an open source web load testing tool
October 4, 2008
In this post I describe in short how to make your first steps in JMeter. I found JMeter when I wanted to test how stable a new written web application was and searched for a tool that allowed me to record my browsing and rerun it multiple (and parallel) times. JMeter is quite pretty easy to get up and running and it’s quite fun to test and break things on your own server.
As JMeter is a Java application the installation comes basically down to extracting the zip/tar.gz file and start bin/jmeter.sh or bin/jmeter.bat, if you’ve setup your Java correctly.
So now to the actual howto:
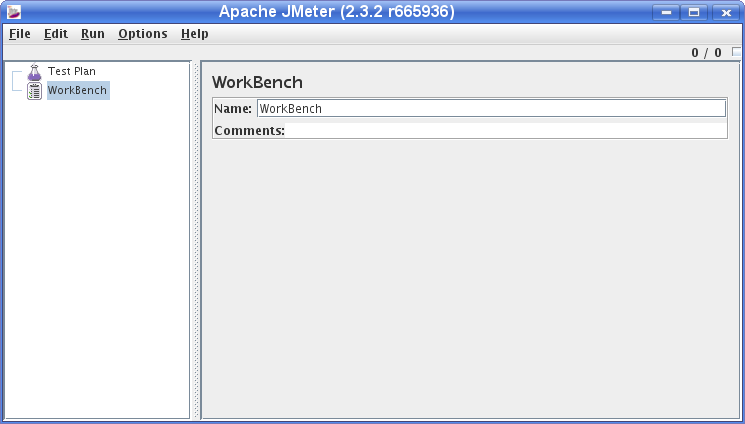
Start Jmeter by changing to jakarta-jmeter-2.3.2/bin and executing ./jmeter.sh You’ll see following screen:
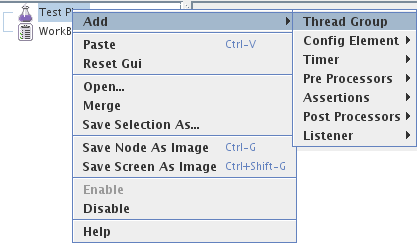
First we add a “Thread group” to the “Test Plan” via right click onto “Test Plan” as shown in following screenshot:
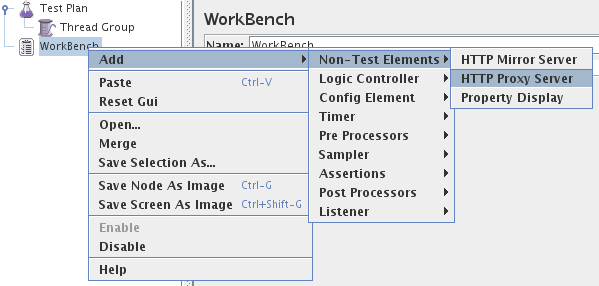
After this we add an “HTTP Proxy Server” to the Workbench (as “Non Test Element”) to capture the traffic between your browser and the web site to test. Following screenshot shows how to add the proxy server.
Open the “HTTP Proxy Server” page and change the port if required and set the “Target Controller” to “Test Plan > Thread Group” on the same page.

Now configure your browser to use the Proxy Server (127:0.0.1:8080 in the default settings) and go to bottom of the “HTTP Proxy Server” page and click the “Start” button. Make also sure that you deleted the cache of your browser or even better deactivated it for the test. Otherwise you will not see the full traffic a new visitor would generate.
![]()
Now, JMeter will record all the HTTP requests your browser makes, so make sure you have closed all the other tabs you have open, otherwise you will get a mixture of Ad’s and AJAX requests recorded as well. After you did click through the workflow JMeter show test later you click the “Stop” Button and take a first look what JMeter has recorded for you.
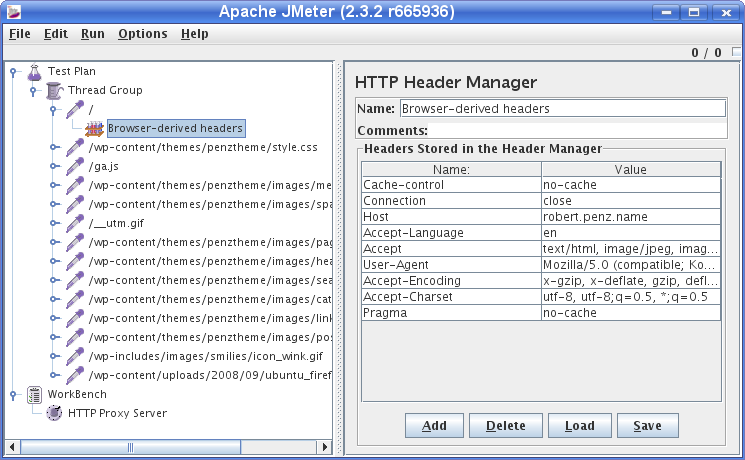
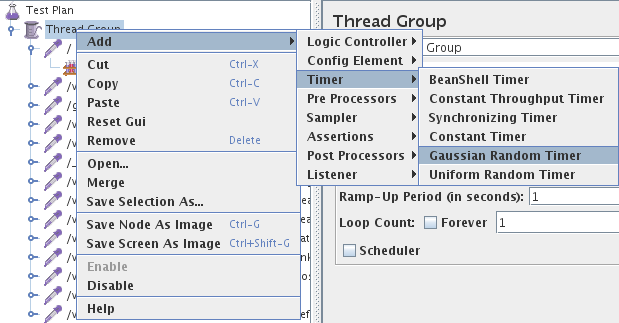
Delete any request that you don’t like by right clicking onto the node and selecting “Remove”. Now we’ve recorded everything we need and we wand now to simulate a typical user. For this we want a time delay between the various http requests and the delay should not be fixed. If you want to query the server as fast as possible to you don’t need this step. We add therefore the Gaussian Random Timer as shown in this screenshot:
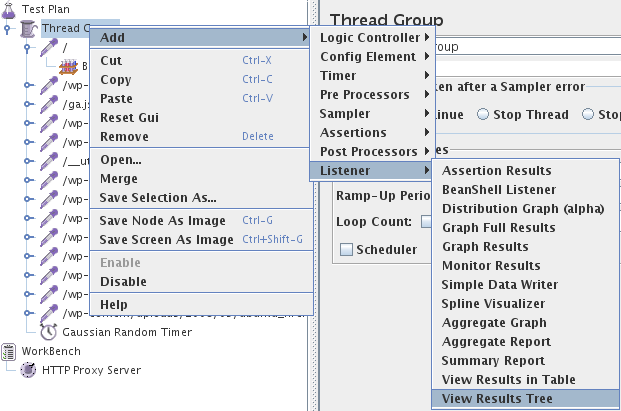
The last thing we need for a first test run is a Listener which tells us what worked and what not. We use for this “View Results Tree”. This Listener is not good for later use when you want to hammer with multiple threads onto the server.
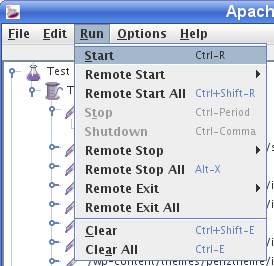
Now we’re ready for our first run, the default settings are fine (in the Menu: Run > Start).
You should get something like this:
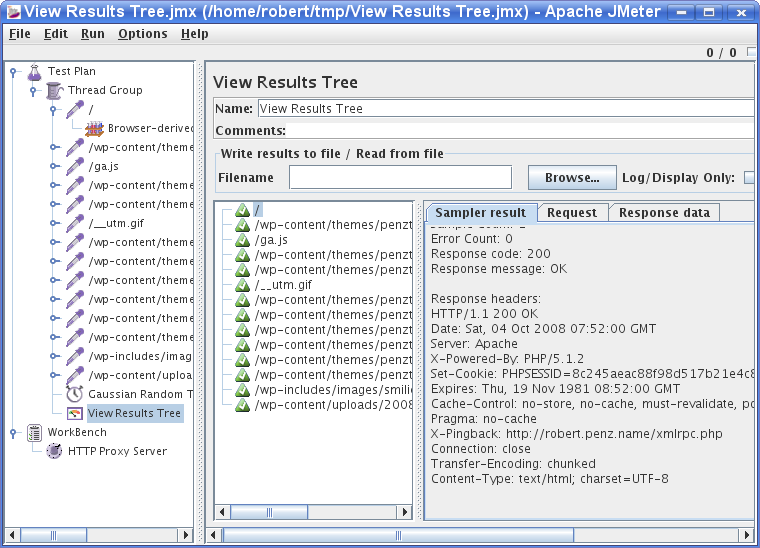
This Listener is good for testing your test setup, as you can look at request and response data. Now it would be the time to add an “Cookie Manager” or “User Parameters”. The First you need if your site requires cookies and the second is handsome when you want different threads to use different user/password combinations to login, as one use can only login once at a time.
After you verified the setup you should disable the “View Results Tree” Listener and choose something like “Aggregate Report”. Change now the settings of “Thread Group” do your likings and hammer your web server. 😉
If you are running a big load test, remember each Listener keeps a copy of the results in memory so you might be better running a Listener > Simple Data Writer instead which writes the results out to a file. You can then read the file in later into any of the reports.
Have fun hammering your web server 😉
ps: Always start with a smaller load, you better off finding and fixing a bug which occurs often under low load, than an obscure bug which occurs only under extreme load.
11 Comments »
RSS feed for comments on this post. TrackBack URI
Leave a comment
Powered by WordPress
Entries and comments feeds.
Valid XHTML and CSS.
42 queries. 0.062 seconds.


Thanks a lot and nice simple for a starter like me
Comment by radhakrishnan — October 18, 2008 #
Thanks and nice and simple for a starter
Comment by radhakrishnan — October 18, 2008 #
I really liked your howto, really direct and simple.. i have seen others but your gives the basic information along with other important options.
Comment by Jose — November 6, 2008 #
Do you have any other jmeter tips or material? i’m working with it and having some difficulties, for example I recorded a script for registering an item in a website and when I run it i don’t see any errors, but when i access the website there are no new items…
regards
jose
Comment by Jose — November 6, 2008 #
I tried the steps and believe followed all, but after record, nothing was recorded at all, what might be missing ?
thanks,
-larry
Comment by larry — November 10, 2008 #
I tried the steps and believe followed all, but after record, nothing was recorded at all, what might be missing ?
thanks,
James
Comment by Jemes — December 5, 2008 #
@Jose: no I don’t have the time currently to write other content.
@Larry, James: Most likely your browser does not use the JMeter as proxy.
Comment by robert — December 5, 2008 #
@larry and jemes : Record your web application using BADBOY testing tool.
download link :http://www.badboy.com.au/
and it has the facility for export script to jmeter in jmx format.after that in jmeter u can add your listeners to monitor your results. hope this will help for you.
thanks
Vasumathy
Comment by Vasumathy — February 3, 2011 #
How to explain Jmeter report to a lehman person.
How can explain about Jmeter report, what are the meaning of Jmeter output terminology?
Early response is highly appreciable.
Thanks.
Regards,
Anirudh
Comment by Andy — April 7, 2011 #
@ Vasumathy
Thanks a lot for ur comment Badboy. Badboy will help me a lot
Regard
Sakthy
Comment by Sakthy — February 1, 2012 #
Here is another how-to’s:
– using HTTP Proxy;
– building test-plan for database from scratch;
BTW, starting from JMEter 2.9 HTTP Proxy has smart feature of suggesting patterns into “Excludes” field.
It can be activated using the following entry in the jmeter.properties:
proxy.excludes.suggested=.*\.js;
By default it has the following value(hardcoded in sources):
proxy.excludes.suggested=.*\.js;.*\.css;.*\.swf;.*\.gif;.*\.png;.*\.jpg;.*\.bmp
But, of course, it can be overrided, if necessary.
Comment by Dzmitry Kashlach — February 11, 2013 #